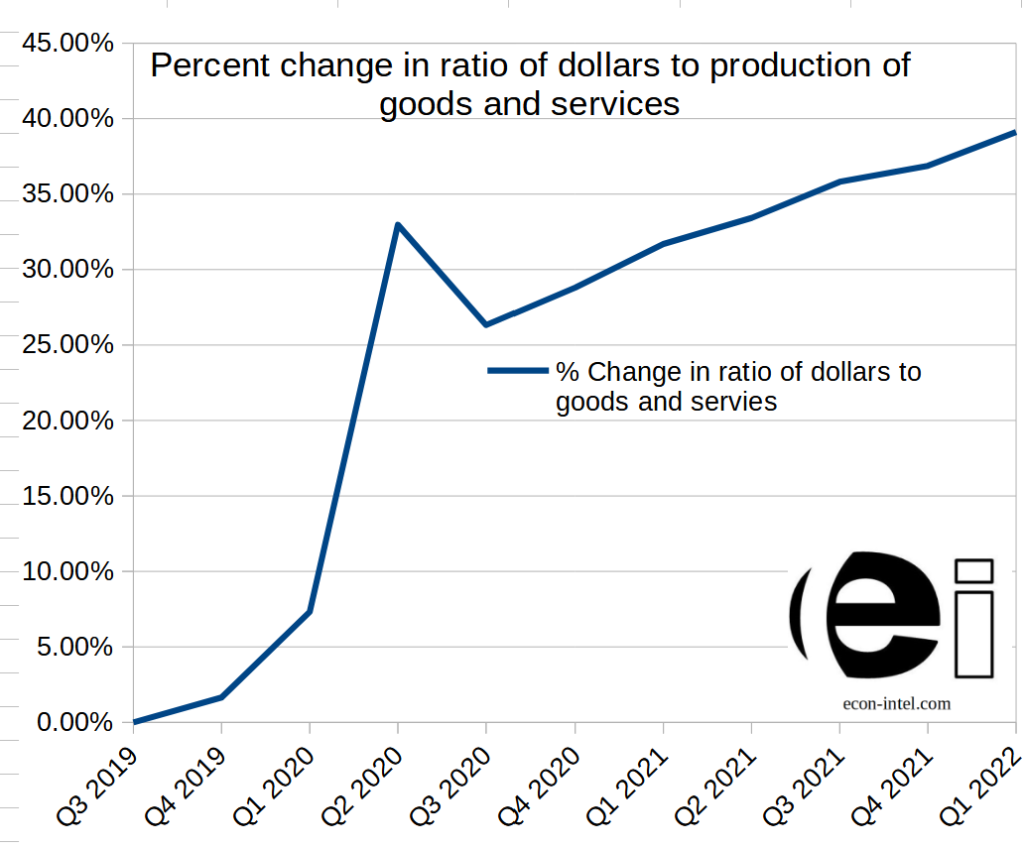
The root cause of Inflation is the change in the ratio of money to the goods and services produced. The recent growth of the money supply has been massive and rapid. This coupled with a dramatic decrease in production and the resulting supply chain disruptions is the root cause of inflation.
Other factors, such as expectations, play a role in the timing and pace of inflation. However, it is misguided to ignore money supply and production to focus on secondary items. Inflation is a virtual certainty when the money supply increases enormously and production drops dramatically. Ignoring this fact sidetracks productive discussion.
Root Cause #1: Decrease in Production of Goods and Services
The world suffered a massive supply shock from “closing the economy” as a response to the coronavirus. For some items, there was capacity to catch up on production once the economy re-opened. For others, there were supply-chain issues or other issues that constrained future production as well. This depresses economic production and elevates input costs.
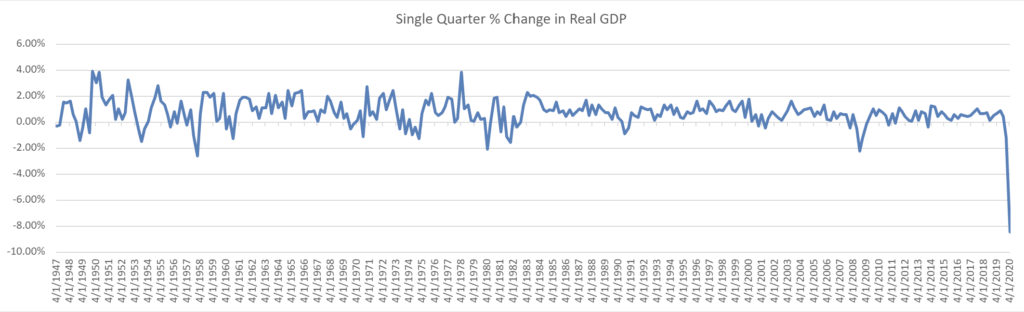
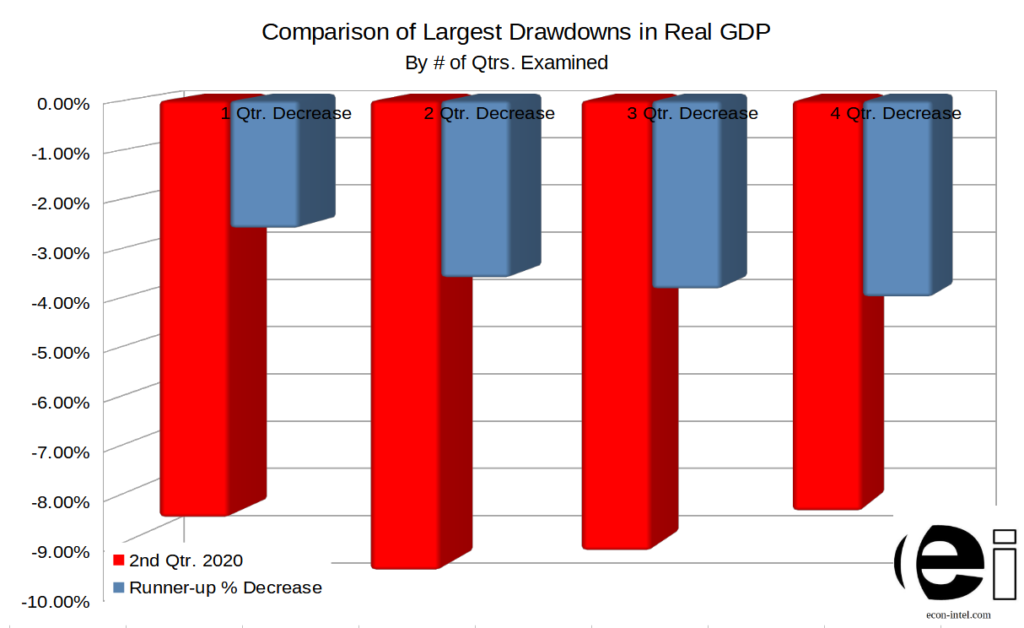
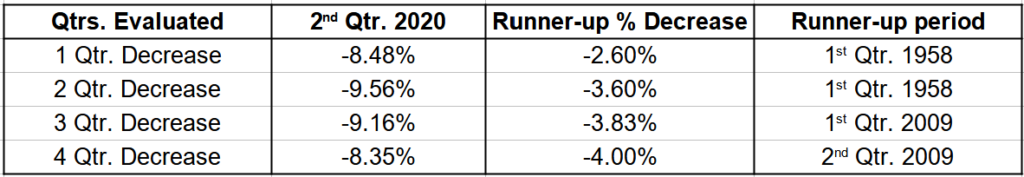
This was the largest single quarter decrease in real GDP in the FRED database that provides this data from 1947. Furthermore, this was not just a record decrease over this period. It dwarfed other contractions. This dynamic holds true over a single quarter, two quarters, three quarters, and a full year. The next most rapid periods of contraction were during the 1st quarter of 1958 when looking at both the single and two quarter decreases. For longer-periods the first and second quarters of 2009 we the closest to rival the 2nd quarter of 2020.
Root Cause #2: Increase in Money Supply
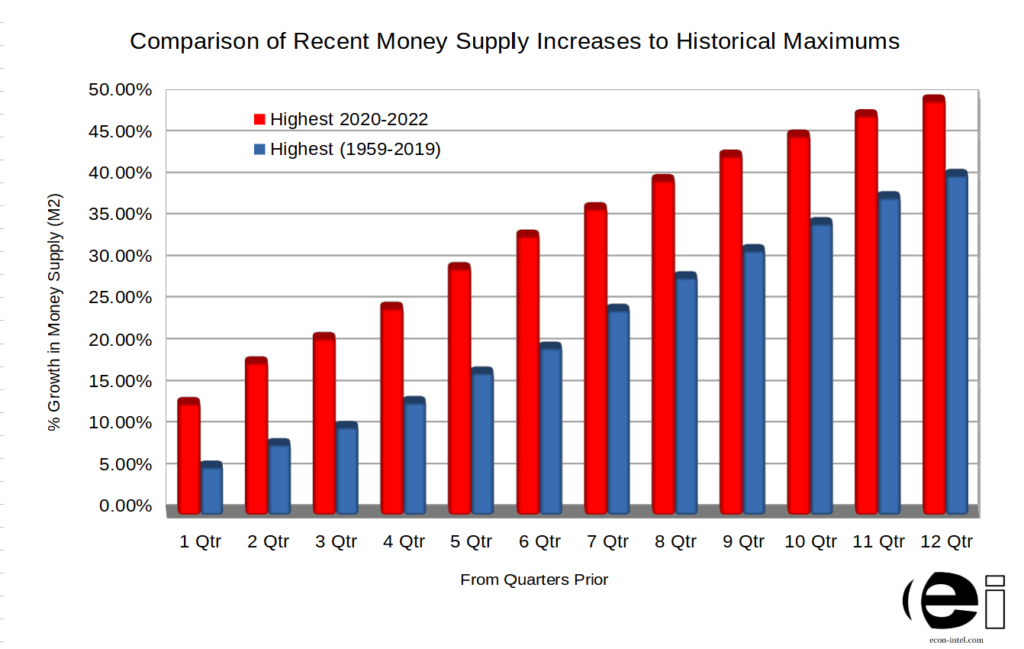
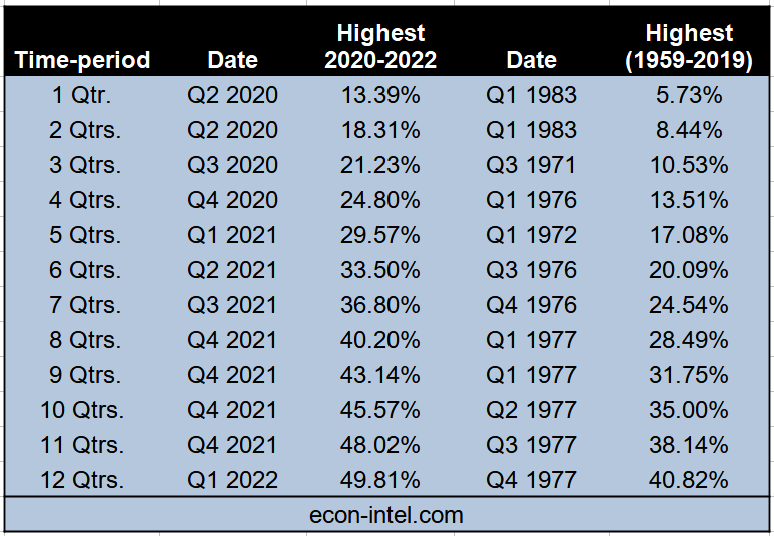
At the same time, the money supply increased massively. We analyzed the data for M2 money supply to find the fastest periods of money supply growth since 1959. 1959 was chosen as this is how far back M2 money supply data is readily available. We looked at twelve different timeframes, ranging from comparing the money supply to the prior quarter through 12 quarters prior. For every timespan, the most rapid period of money supply growth was in the 2020-2022 period.
The largest single quarter increase was from Q1 2020 to Q2 2020 where the money supply grew 13.39%. This is more than doubled the next most rapid quarter outside of the 2020-2022 period. Q1 1983 money supply grew 5.73% from the prior quarter. In other words, the rate of increase for Q2 2020 was more than twice as rapid as the prior record.
For every time-frame examined (1-12 quarters) this pattern held true. The highest rate of growth was from 2020 through 2022. So not only was the money supply growth incredibly rapid, it also persisted for an extended period of time.
Additional, all periods reviewed outside of 2020-2022, registering the rapid money supply growth were in the 1970s and early 1980s. Another period of elevated inflation.
Summing Up The Root Cause of Inflation
Money Supply:
- Most rapid period of money supply growth was Q2 2020. More than 200% greater than any period outside of the 2020-2022.
- All other timeframes from 2-12 quarters were also higher in the 2020-2022, than any other period. There were no exceptions. This period consistently was the highest money supply growth period.
- All of the periods that came in 2nd to the 2020-2022 period for money supply growth were in the 1970s and 1980s, another period exhibiting significant inflation.
Plummeting Production:
- Production plummeted at the fastest rate seen in the data series going back to 1947. The single quarter decline was more than three times as severe as the next most significant decline which was recorded in 1st quarter or 1958.
- The decrease in production, lead to material shortages and supply chain disruptions that put downward pressure on production and increased production costs for a long-time and continue today.
Unique This Time:
This time BOTH a massive increase in the money supply and plummeting production occurred at the SAME time. In the past, all of the highest money supply growth periods were within the 1970s and early 1980s. While this period did have contractions, none of them ranked in our study of the most dramatic contractions. Those periods were in 1958 and 2009, depending upon the length of the time-period examined.
This time, by far the most significant (and a very persistent) increase in money supply was at the SAME time as the most abrupt decrease in production.
These factors together lead to an incredible increase in the amount of money available per unit of production. The logical result is inflation.
Stay in tune with the money supply and inflation as they evolve over time.
Mind blown? If you learned something or found it interesting, you can easily share:Follow us here: 


