The banking dashboard is designed to give you an overview of the state of the banking industry. This includes general trends, liquidity, and risk factors.
Number of banking institutions declining long-term
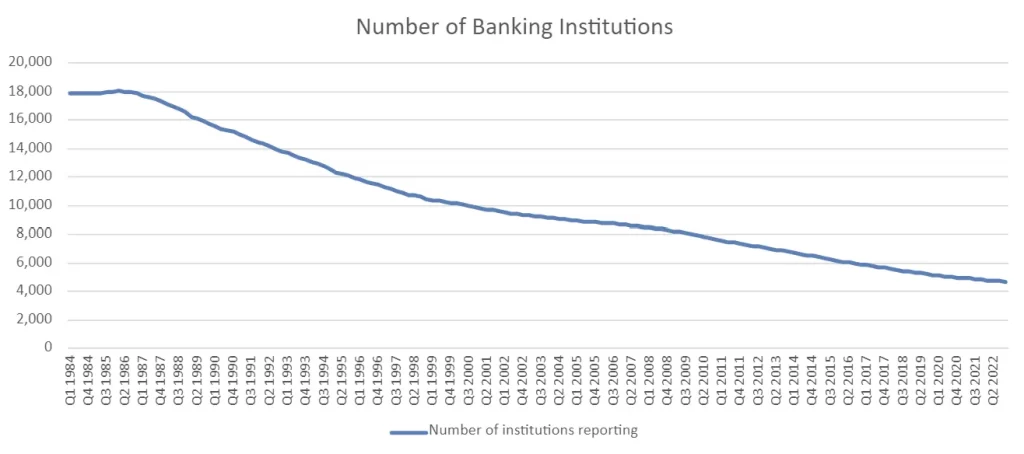
The pattern of long-term continuing consolidation of the banking industry remains consistent. There were 17,885 different banking institutions as of the 1st quarter of 1984. As of the 4th quarter 2022, there were 4706 institutions. Down 90 institutions from the 1st quarter of 2022, from 4796 in 1st, to 4706 in the 4th quarter.
Percentage of customer deposits that bank cash will cover
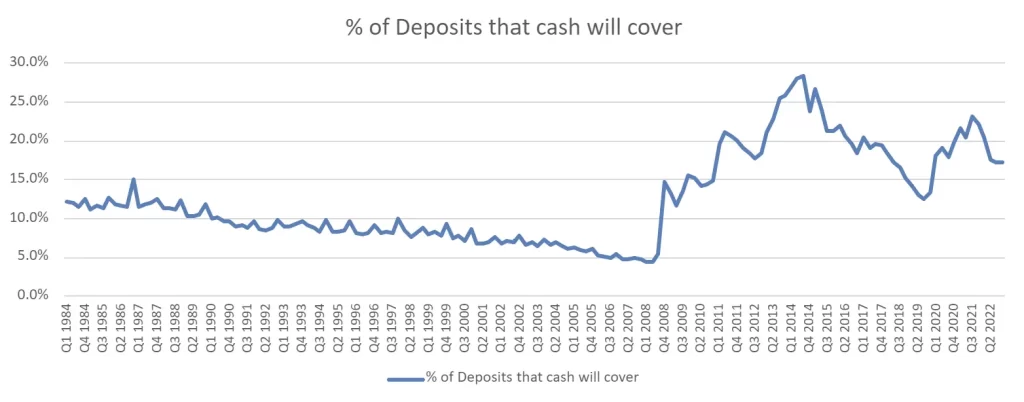
The decline in the liquidity of banks (as measured by the percent of customer deposits that the banks’ cash will cover) was evident until the 2008 crisis. The Fed and government reacted with stimulator measures, increasing cash in the banking system. After that, the decline resumed until the Federal Reserve and government injected stimulus in response to the coronavirus. Since Q3 of 2021, when bank cash would cover 23.1% of deposits. This decline has resumed and stands at 17.3% in the 4th quarter of 2022 (unchanged from the prior quarter).
Derivatives held by banks
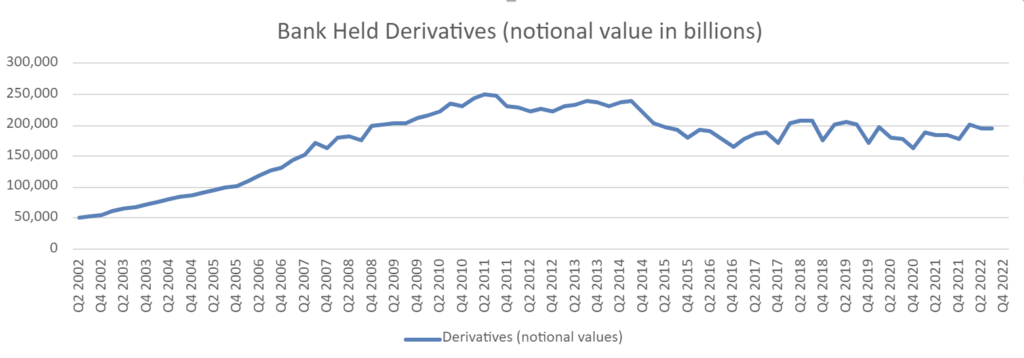
Bank-held derivatives are often cited as a significant cause of the 2008 financial crisis. Despite much discussion of reducing exposure to risky derivatives in the aftermath of the crash, derivative exposure remains high. The total notational value of bank-held derivatives is over $200 Trillion as of the end of Q1 2022. This represents an increase of almost $23 Trillion from the prior quarter. Q1 2022 and Q2 2022 values both exceed the Q3 2008. Lehman Brothers filed for bankruptcy in Q3 2008. Q3 bank derivatives increased by approximately $235 billion to exceed $195 trillion. Publication is pending for the 4th quarter.
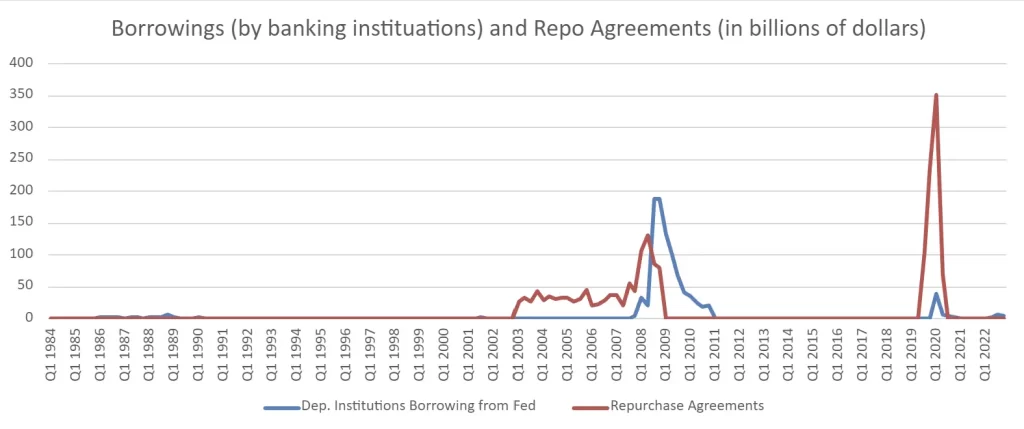
Bank borrowings and repo agreements outstanding
See our most recent article regarding the bank failures and current liquidity crisis.
During the 2008 financial crisis, both Repo agreements and borrowing from the Federal Reserve spiked dramatically. The total value of these loans peaked in the 4th quarter of 2008 before receding back to single digit billions by 1st quarter of 2012. Then to essentially nothing by 1st quarter 2013.
As of Q1 2013, there were 26 quarters where banks and financial institutions did not need to borrow from the Federal Reserve. Banks did not borrow either directly or through Repos. Repos began surging again beginning in the 3rd of 2019. This was before any financial impact of coronavirus would be expected. Direct borrowing following a couple of quarters later. At the end of 1st 2020, $393 billion was outstanding between these loans. In this same quarter, the Fed reduced the reserve requirement for banks to 0%. Additionally, large stimulus programs by the Fed and the government began at this time. As of Q4 2022 levels of Repos and borrowings remain well below both of these recent peaks. Q1 2023 would normally be the next time that we report data, but due to the recent bank failures, some related information is covered here.
Data and sources supporting all of the banking charts above plus additional related information:
Want to see banking industry news?
By: Econ-Intel data team
Mind blown? If you learned something or found it interesting, you can easily share:Follow us here: 


