Money Supply and Inflation Graph
Money Supply and Inflation Narrative
Understanding inflation is key to understanding economic conditions. Understanding the relationship between the money supply and inflation is key to understanding inflation itself. Inflation will likely play a significant role in economic and political debates for the foreseeable future. Therefore, a clear understanding of what inflation is and how it behaves will be central to the proper functioning of government and Fed policy. Likewise, inflation influences a multitude of business and personal decisions.
Defining Inflation
Inflation is often defined as the rise in the price of goods and services:
a continuing rise in the general price level usually attributed to an increase in the volume of money and credit relative to available goods and services
merriam-webster.com
This definition provides a means to measure inflation, but a more complete understanding is advantageous. It is more useful to think in the following way:
Inflationary pressure: The result of an adverse change in the ratio between the quantity of money circulating and the quantity of goods and services produced or an increased cost of producing them.
Inflation: A manifestation of inflationary pressure leading to less purchasing power from the same amount of money.
Money Supply, Production, & Inflation
There are a number of differing models intended to illustrate the causes of inflation. However, if you keep in mind the definition suggested above for inflation, it simplifies and sufficiently covers the root causes.
Inflationary pressure: The result of an adverse change in the ratio between the quantity of money circulating and the quantity of goods and services produced or an increased cost of producing them.
Inflation: A manifestation of inflationary pressure leading to less purchasing power from the same amount of money.
econ-intel.com
Breaking this statement down, one can determine that there are two causes of inflationary pressure. First, is the money supply. Inflationary pressure builds as money is created faster than the growth in goods and services. If circulated, this money would cause the ratio between the goods and services to shift. With more money circulating and the same number of goods and services, money becomes less valuable in terms of goods and services.
Second, if there are constraints in the production of goods and services, it causes inflationary pressure. Even if the money supply is constant.
Inflationary Pressure vs Inflation as Measured by CPI
So, the simple drivers of inflationary pressure have been defined. Why then is defining inflation not just this simple? And can inflationary pressure exist without a corresponding rise in inflation? Yes, based upon people’s decisions. Here is how that works. When a person obtains more money there are two options. The person can save or spend the money. Money invested counts as savings for the purposes of this discussion. These savings generally do not flow into goods and services. As such, they are not measured as inflation. Since inflation measures the price level of goods and services. The other option is to spend the money. In this case, the new money is circulating through goods and services and would contribute to inflation. As an example, money invested in stocks or bonds would not drive inflation measures higher.
Many individuals may have a propensity to spend money as it comes in. But, when analyzing the effects of new money on the inflation rate, it is important to account for banks, large corporations, and businesses. These entities are likely to have a higher propensity to save or invest the money than to spend it. Additionally, they often control far larger sums of money. Because of this, it is possible for the money supply to grow more rapidly than the production of goods and services, without inflation increasing by the full change in the ratio between the money supply and production.
Role of Expectations
Expectations also play a role in determining the rate of inflation. An individual is more likely to make a purchase if they expect the price of a good or service to rise in the future. This increases the current circulation of money and can quite possibly show up as inflation. Additionally, if someone is expecting a general trend of inflation for the foreseeable future, they are more likely to charge a higher rate for their goods or services. This is also inflationary and is a driver behind why inflation is so difficult to tame once it gets going.
Understanding This Graph
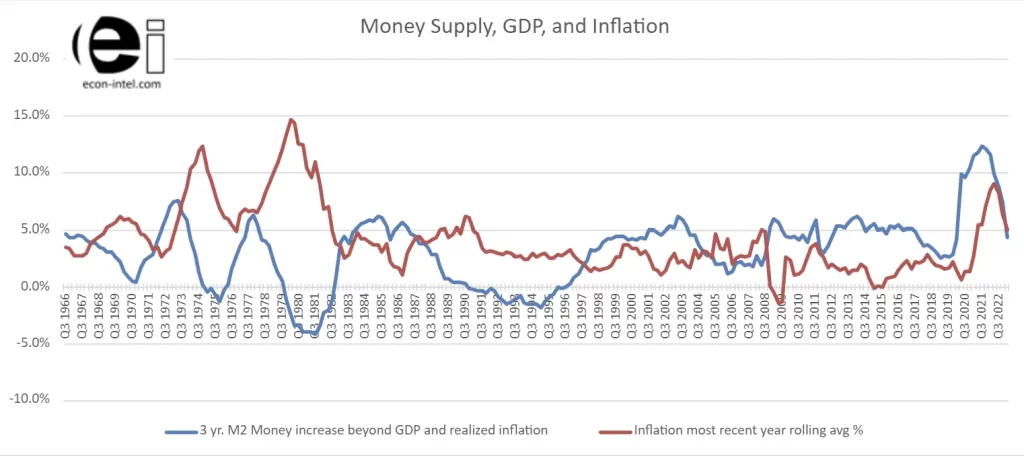
This graph shows the medium to long-term relationship between the money supply and the rate of inflation. It graphs the most recent three-year change in the money supply, after subtracting the amount of realized inflation and the growth in GDP during the same period. Hence, the blue line shows the change in money supply while taking into account changes in GDP and inflation.
The red line is the current year’s rate of inflation.
Noteworthy Observations
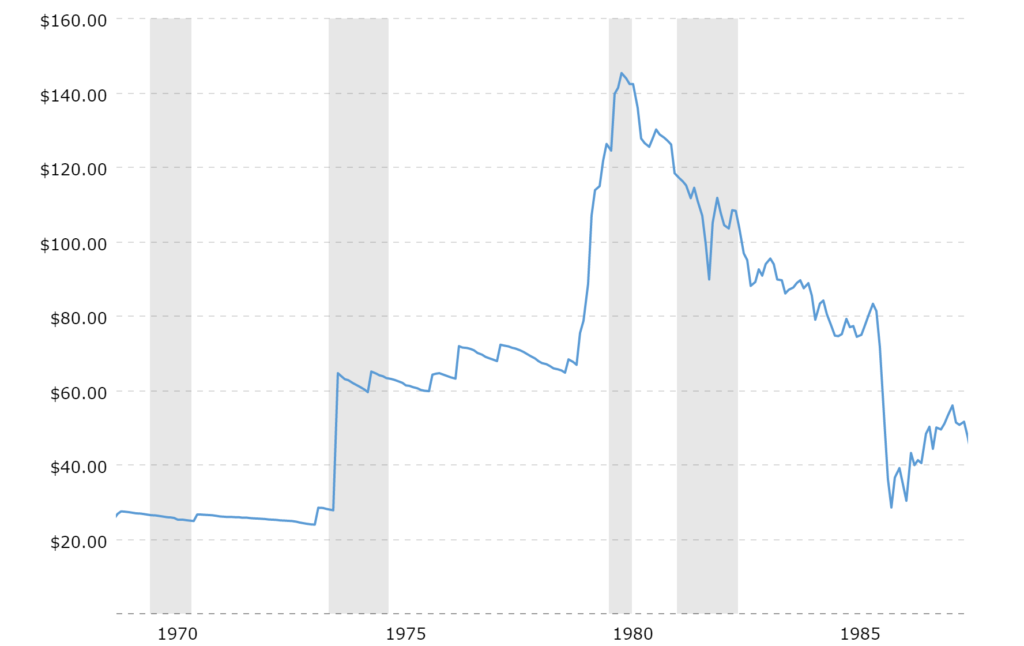
Increases in the money supply paired with constraints in production factors lead to the most dramatic increase in inflation. The first period of particularly high inflation was during the 1970s and early 1980s. As the headline graph shows, the money supply increased rapidly, followed by high inflation in the early 1970s. Additionally, high oil prices also plagued the 1970s. Oil prices are an input into many other products and services, including the transportation of almost all other goods. This pairing of rapid increases in the money supply and the rising cost and scarcity of oil, led to the first period of particularly high inflation.
The second high period of inflation is occurring presently. The current inflation rate exceeds other periods of U.S. history except for the 1970s and early 1980s. Like the 1970s, the current period is also occurring as the money supply has grown dramatically. The recent rate of growth in the money supply exceeds any other period charted. The current increase in M2 money supply occurred more rapidly and was a greater percentage change than in the 1970s.
Like the 1970s, there are current supply constraints. Production and transportation of many items ceased during coronavirus restrictions. The lingering supply chain interruptions remain an impediment to efficient production at this point in time. China is still implementing stringent lockdowns. Delays in parts are impacting efficiency in final production of goods and services. Electronics impacting vehicle production is one of the most discussed.
The impact of sanctions related to the war in Ukraine weighs on production in many ways. Energy costs and reliability both degraded substantially. Leading to elevated input costs across a wide range of products and services. These current challenges parallel and may exceed the challenges seen in the 1970s.
A Long and Costly Recovery
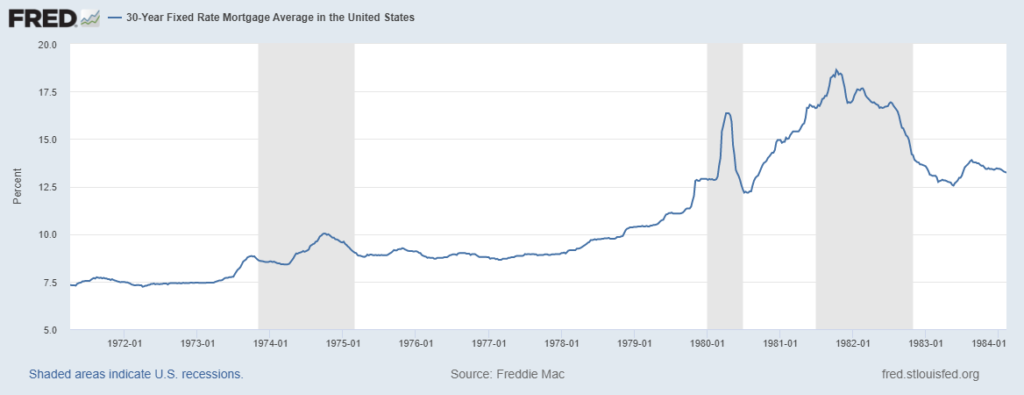
Once inflation becomes established, it is difficult to defeat. Inflation reached 6% in Q2 1973 and was 12.3% in Q4 1974. It did not return to below 4% until Q4 1982. The fight was costly and fought for many years. As the Fed fought to tame inflation, 30-year fixed mortgage rates more than doubled. Other borrowing costs increased in a similar manner. The graph below shows the 30 year fixed mortgage rates during this time. Gray bars reflect recessions.
Money supply creation (as measured by M2) in response to the coronavirus shutdown was rapid and of greater magnitude than during the 1970s. The current supply chain issues and energy concerns rival and may exceed those seen in the 1970s. Learn more about the tools that the Fed has to fight inflation and the constraints it faces, How Much Can The Fed Tighten?
Recovery from the 1970s inflationary period was more than a decade-long process. It was necessary to drive money supply growth below the rate of GDP growth once accounting for realized inflation to eventually curb inflation in the 1980s. Current monetary growth by this measure decreased from earlier, but is still expanding at a relatively high rate. The monetary conditions required to tame 1970s and early 1980s inflation were far more restrictive than those currently in place. The graph does show a welcome short-term decrease in the rate of inflation. Fed interest rate hikes have been aggressive, so the decline in inflation may come more rapidly than during the 1970s and early 1980s. However, if history serves as a guide, taming inflation will be a long and costly journey.
To see the data behind the money supply and inflation dashboard and more check out: The money supply and inflation data page.
Mind blown? If you learned something or found it interesting, you can easily share:Follow us here: 


