Federal Reserve Developments
The Federal Reserve Dashboard helps view the effects of Federal Reserve Policy and provides insight into the financials of the Federal Reserve. Federal Reserve Policy plays an enormous role in the condition and direction of the economy. As such, understanding what is going on and the moves that the Fed is making is important and relevant.
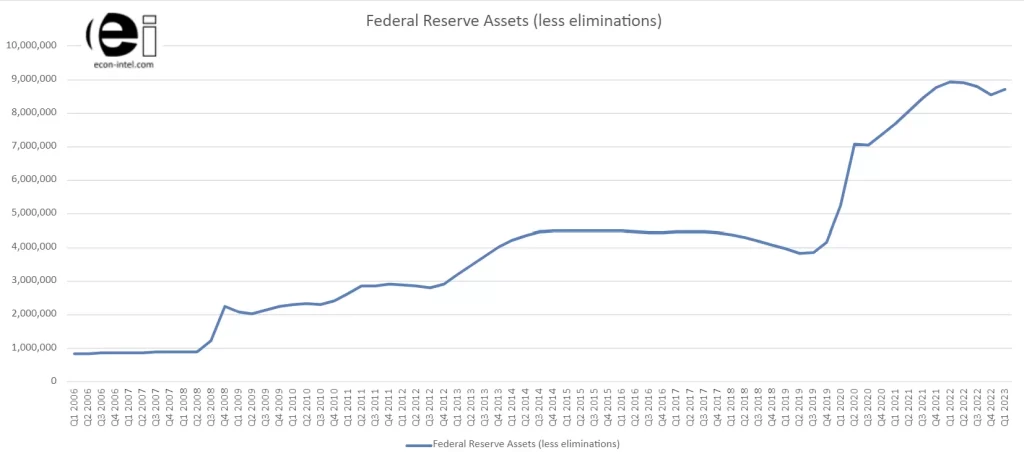
Total Federal Reserve Assets illustrate relatively slow growth during normal times. During crises (great recession and coronavirus), the Fed expanded its holdings rapidly. The Fed’s assets exploded from Q2 2008 to the end of Q4 2014 in response to the great recession. Starting at approximately $893 billion and ballooning to just under $4.5 trillion ($4,500 billion) by Q4 2014.
Afterwards, there was a slow overall unwinding where total Federal Reserve Assets dropped. They tallied a little over $3.8 trillion at the end of Q2 2019.
As of Q3 2019, Federal Reserve assets began increasing rapidly. Exploding to more than $8.9 trillion in Q1 2022. Since then, a slow reduction of Federal Reserve assets had been in progress. However, that unwinding of the balance sheet was interrupted by the banking crisis. It will be interesting to see if the Fed is able to resume their planned tightening during the current quarter, or they are required to remain accommodative to reduce bank stress.
Federal Reserve Asset Composition
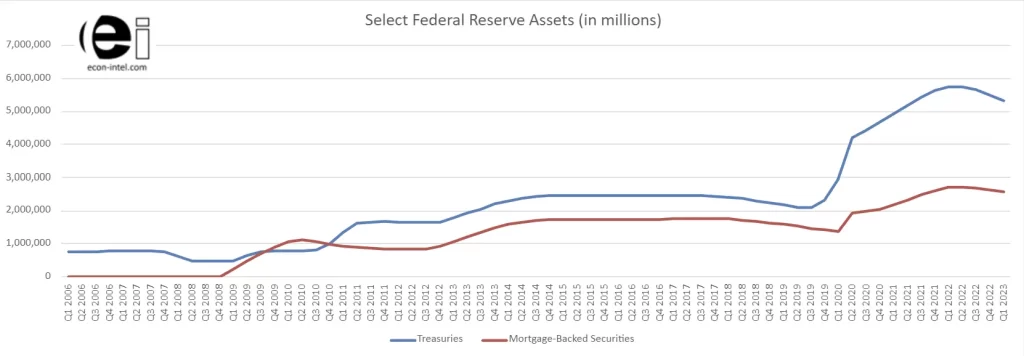
Through Q4 2008, the Federal Reserve had not invested in any mortgage-backed securities (MBS). Beginning in Q1 2009, the Federal Reserve began purchasing MBS in response to the 2008 financial crisis. The ownership of MBS by the Federal Reserve is a sizable and important change. MBS are higher risk investments than treasuries. Tremors in the mortgage market flow through to MBS. Mortgage defaults reduce the total amount of principal that will be returned. Additionally, the timing of the receipt of principal is uncertain. The payments made on the underlying mortgages are what determine the payments on the MBS. The higher risk and reduced predictability of MBS compared to treasuries could impact the Fed’s ability to implement the most effective monetary policy.
Federal Reserve Liability Composition
Recent new development in liability composition
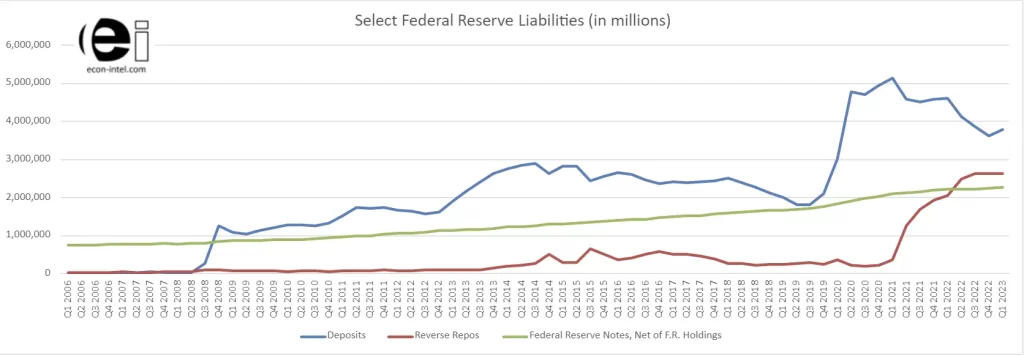
Two separate noteworthy developments are emerging in the composition of the Federal Reserve liabilities. First, the 4th quarter of 2022 marks the first recent quarter where the Fed’s level of Reverse Repos declined. This is a significant development as it shows that a reduction in liquidity is occurring beyond the banking industry and emerging in the money markets as well. This development was short-lived as Reverse Repos increased again in Q1 of 2023.
Along side this recent development, the trend of bank deposits at the Fed continued to decline through the end of last year. However, during the first quarter of 2023, bank deposits at the Fed increased by about $160 billion.
Longer-term trend in liability composition
The composition of the Federal Reserve’s Liabilities has changed significantly over the last several years. Through Q3 2008, federal reserve notes were by far the largest liability of the Federal Reserve. However, by the next quarter, deposits from the banking industry held at the Federal reserve had surpassed the value of cash (federal reserve notes). Because the Federal Reserve pays interest on deposits and Reverse Repos, these changes to the Federal Reserves balance sheet have contributed to the Federal Reserve losing money. Our Federal Reserve Losses Dashboard provides additional specific details and data. Additionally, we have several articles covering the topic:
- Fed Losses: the Fed is Losing Money.
- February Begins With More Losses for the Federal Reserve
- Fed Sets New Record: Biggest Loss Yet!
Like deposits, Reverse Repos were a small portion of the Federal Reserve’s liabilities through Q4 2020. At this time, Reverse Repos constituted only about 1/10th the value of the cash outstanding. After that, the Repo liabilities grew rapidly. As of Q4 2022, the repos outstanding are a became a larger liability to the Fed than cash.
This pair of changes has important policy implications. First, as mentioned above, the cash liability does not expose the Fed to interest expense. In contrast, the Fed pays interest on both deposits held at the Fed and reverse repos. This can significantly impair the Fed’s ability to tighten the money supply. How Much Can The Fed Tighten?, dissects this issue along side many others that are currently relevant.
Second, by changing Federal Reserve Policy and entering the reverse repo market, the Fed has taken on a role that it traditionally has not held. Only banks can deposit funds at the Fed and receive interest. In contrast, the Federal Reserve will engage in Reverse Repo trading with 2a-7 money market funds as well. This extends the influence of the Fed from influencing banks, to influencing the money market industry directly as well. By extending their influence on interest rates into this arena, the Fed reduces the element of free market rate discovery.
Federal Reserve Data Series
Data for all of the data series presented above, plus more, is available in the table below. This is done to encourage additional exploration of the raw data for greater understanding. Sources for all the raw data is embedded directly in the table to make verification easy. We update our Federal Reserve Dashboard regularly, so consider bookmarking this page or subscribing to our newsletter if you found the information useful.
Mind blown? If you learned something or found it interesting, you can easily share:Follow us here: 


