How much U.S. debt does the government hold?
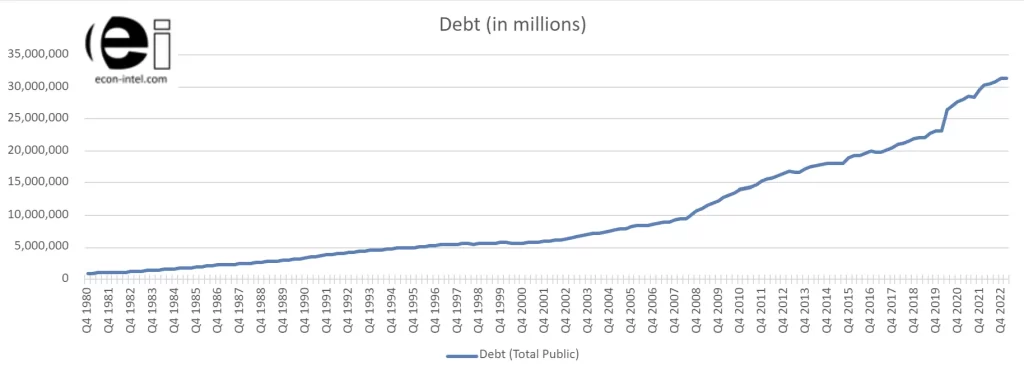
$31,458,438,000,000 (~$31.4 trillion) is how much debt the U.S. government holds. This is as of the end of the first quarter of 2023. The graph below shows the growth in U.S. government debt from the end of 1980 through the end of 2022. The U.S. debt owed by the federal government was $930,210,000,000 as of the end of 1980 and grew to almost 34 times that amount by the end of the first quarter of 2023, reaching more than $31.4 trillion.
The United States is a big country with a massive national debt. To convey the magnitude of this debt in more personal terms, we will look at debt per person. Dividing the current debt by the U.S. estimated population of 334,561,844, found by setting the population clock to 3/31/2023, calculates to approximately $94,029 of debt per person at this time. This is a substantial debt burden on a per person basis. This calculation includes children and retired people, not just income earners.
The chart below shows the U.S. national government debt over time. Bend points in the graph are apparent where the growth in debt accelerated. These are apparent around the 2008/2009 financial crisis as well as early 2020 in response to the coronavirus.
The Federal Government Data page contains cited sources for all of the graphs presented here.
Recent U.S. federal government debt by quarter
The chart below shows the cumulative debt of the U.S. Government for some of the most recent quarters. Total U.S. Government debt increased much more slowly this quarter than during the recent past as the debt limit was reached. The increase in debt in the first quarter of 2023 was just under $39 billion. Debt growth may very well re-accelerate in future quarters since the debt ceiling has been raised.
| Q1 2022 | Q2 2022 | Q3 2022 | Q4 2022 | Q1 2023 |
| $30.4 | $30.6 | $30.9 | $31.4 | $31.4 |
Values in trillions of dollars (rounded). More precise numbers and a longer history are contained in the table at the bottom of this page.
Federal government debt accumulated by quarter
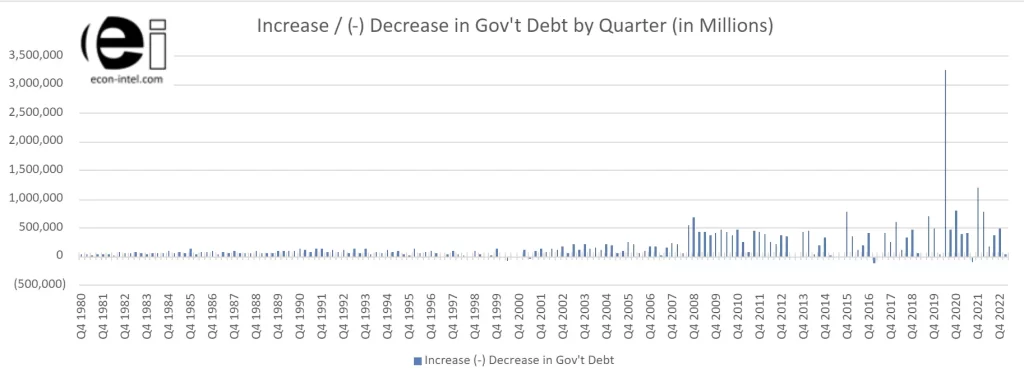
The graph below shows the national debt that the federal government accumulated per quarter. The first time that an individual quarter resulted in additional debt of more than $500 billion was in the third quarter of 2008 at $532.7 billion. This record was followed in the fourth quarter of 2008 with $675 billion in new debt creation.
More significantly, the first time that new debt creation in a single quarter exceeded $1 trillion in new debt creation was in the second quarter of 2020, when $3.253 trillion of new debt was created. This is more than four times the prior record of $771.6 billion set in the fourth quarter of 2015.
Comprehending a trillion of anything is challenging. For perspective, this is the creation of about $9,723.16 of new government debt per person in the U.S during just those three months. This additional debt is per person, not per taxpayer. So, for a family of three, that would increase the share of U.S. government debt for the family by about $29,169.49 in just those three months. This calculation is based upon the same population statistics cited above.
National government debt as a percentage of GDP
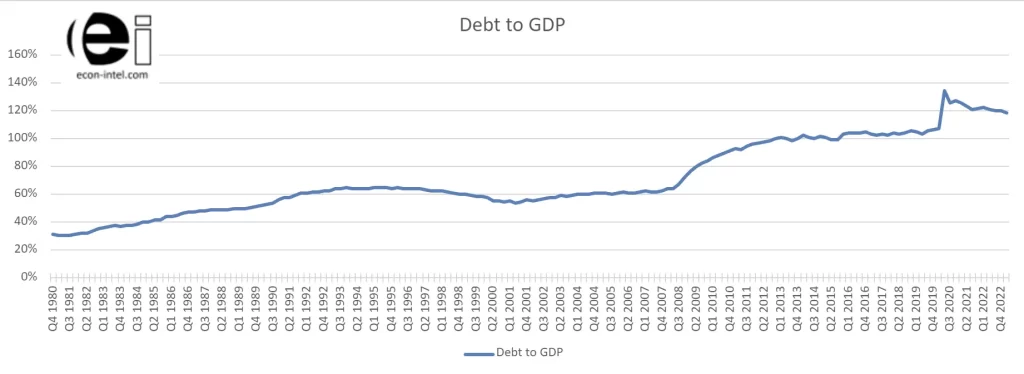
Looking at total debt on its own does not tell the full story. Comparing national government debt over time is somewhat complicated as it is likely that both the national debt and the nation’s economy tend to grow. Comparing the national debt as a percentage of GDP puts the debt into perspective, since GDP is somewhat indicative of the country’s ability to afford the debt and interest. Like many countries, the U.S. government debt as a percentage of GDP has grown over time. In the fourth quarter of 1980, the national debt was approximately 31% of GDP. As of the first quarter 2023, the national debt as a percentage of GDP stood at approximately 119%. That is a big change in the debt burden over a relatively brief period of time.
The total level of the national government debt as a percentage of GDP and the interest rate on the debt are primary drivers in the ability to service the debt’s interest and to pay down the debt itself. As you can see from the chart below, there are a few periods where the percentage of debt compared to GDP did shrink. This indicates that it is possible for the U.S. to reduce the overall level of debt. At least in comparison to GDP. However, the graph also makes abundantly clear that the overall trend has been toward having a higher national government debt as a percentage of GDP. This unfavorable trend is more pronounced after 2008.
National debt growth rate
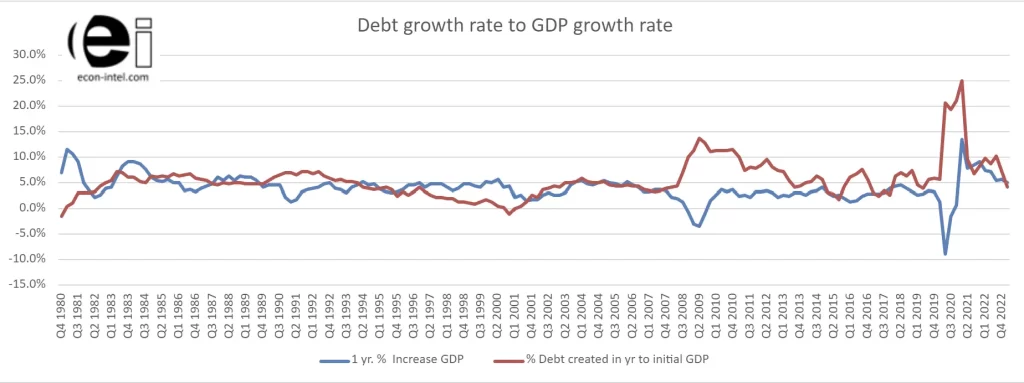
Likewise, comparing the growth rate of the national debt to that of GDP illustrates if the creation of new debt is growing faster or slower than GDP. This graph looks at the amount of debt created over a rolling one-year period compared to GDP at the beginning of the period. During the periods when the blue line is above the red line, GDP is growing more rapidly than debt.
So, while the debt may still be growing, the nation’s GDP is growing faster. During the periods where the red line is above the blue line, the debt is growing faster than GDP and therefore faster than the nation’s ability to pay for it.
In examining the history of debt growth, it is clear that debt production was elevated around the 2008 financial crisis and during the fiscal stimulus in response to the coronavirus. In both cases, a return to lower rates of debt creation is evident after the initial response. However, while the gap closed somewhat after the initial responses to these financial stresses, the gap between debt growth and GDP growth has remained elevated overall since the 2008 financial crisis. A debt that grows overtime at a rate faster than the means to pay it is unsustainable in the long-run.
A hard and absolute limit to government debt
How much U.S. government debt is too much? The country may be dangerously close to having taken on too much debt. The government debt is growing and the rate of its growth has accelerated. It is reasonable to be concerned about when the debt will hit a hard limit. To be clear, “hard limit” is not referring to the debt ceiling that is set, argued about, and raised repeatedly by congress. This is about a natural limit on the amount of debt that the country can acquire and service. At the latest, any entity will hit a hard limit on the amount of money it can borrow when its receipts can only service the interest on its debt.
This government debt limit calculator forecasts how long government receipts can cover the interest payments on the debt. At the point that the interest payments alone consume 100% of government receipts, the government will have hit a hard and absolute debt limit. There would be no entity with sound financial reasoning that would be willing to loan to a government that can not pay anything beyond their interest payments.
It is possible that the Federal Reserve could be forced into loaning funds, but this will increase inflationary pressure. The current elevated rate of government debt creation is unsustainable. Additionally, the high level of debt is kryptonite to the U.S. dollar. Countries warry of potential default (or devaluation) are less likely to hold dollars. Dollars and U.S. bonds are starting to be seen as a more risky asset. At the same time, increasing debt, means that most likely the Federal Reserve will have to step in as a buyer of government debt, which will limit its ability to tighten monetary policy.
FAQ
As of the end of the first quarter 2023, the U.S. government debt totaled $31,458,438,000,000 (~$31.4 trillion). This calculates to a little over $94,000 per person in the United States.
As of the end of the first quarter 2023, the U.S. government debt totaled $31,458,438,000,000 (~$31.4 trillion). This calculates to a little over $94,000 per person in the United States.
Continue exploring U.S. government financial data
We believe providing data for independent exploration is important for sound economic reasoning. To these ends, we provide the data for all of the graphs, with their sources to readers on the Federal Government Data page.
Mind blown? If you learned something or found it interesting, you can easily share:Follow us here: 


